

From life tables to language models
For most of its history, predicting behaviour meant predicting a population’s average. Language models made it possible to try predicting each individual, and the research since 2023 has measured how well that works.
-
1662The first life table
John Graunt worked out from London’s weekly bills of mortality that single deaths are unpredictable but deaths in aggregate are regular.
Graunt, 1662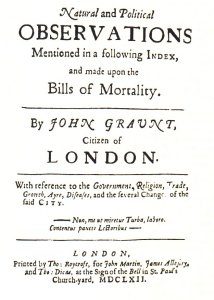
-
1835The average man
Adolphe Quetelet described the “average man” and showed that rates such as crimes and marriages recur at nearly the same level each year. In 1846 he fitted the normal curve to soldiers’ chest measurements.
Quetelet, 1835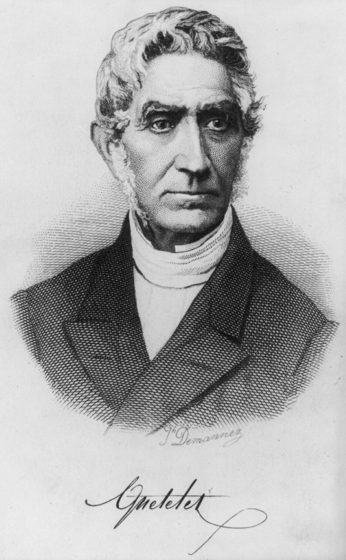
-
1936The scientific poll
George Gallup called Roosevelt’s landslide from a quota sample of 50,000, after the Literary Digest forecast a Landon win from 2.4 million returned ballots. Its mailing lists leaned towards better-off households, and Landon supporters were more likely to send their ballots back.
Squire, 1988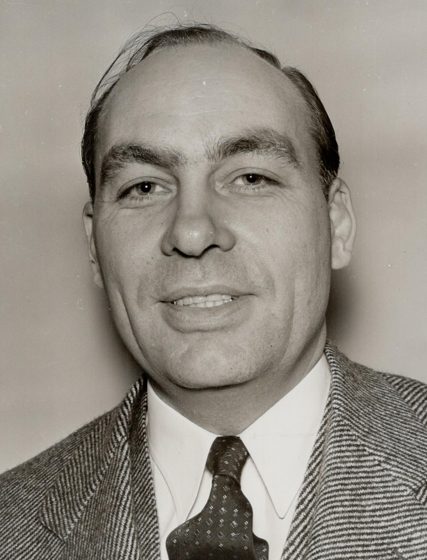
-
1949The Monte Carlo method
Nicholas Metropolis and Stanislaw Ulam published the method of estimating an outcome by running many randomised trials on a computer.
Metropolis and Ulam, 1949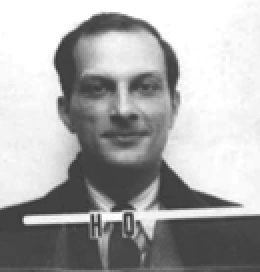
-
1955Bounded rationality
Herbert Simon argued that people choose with limited information and time, settling for options that are good enough rather than the best.
Simon, 1955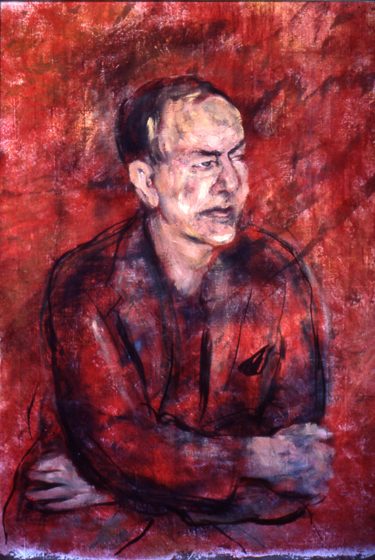
-
1957Microsimulation
Guy Orcutt proposed modelling the economy as many individual people, households and firms, each making decisions, instead of only as aggregates.
Orcutt, 1957 -
1959The People-Machine
The Simulmatics Corporation sorted the electorate into voter types and predicted their responses. It advised the 1960 Kennedy campaign, and many of its predictions could not be tested.
Lepore, 2020 -
1961System dynamics
Jay Forrester at MIT modelled organisations as stocks, flows and feedback loops run on a computer, in Industrial Dynamics. He applied the method to a city in Urban Dynamics (1969) and to the world in World Dynamics (1971).
Forrester, 1961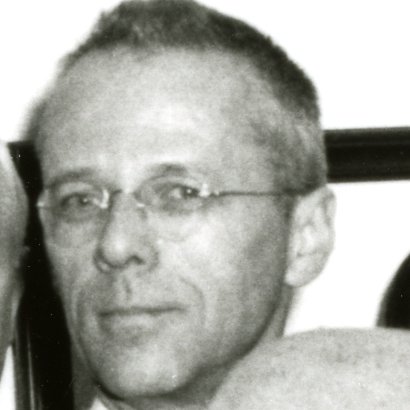
-
1970The Game of Life
Martin Gardner’s Scientific American column introduced John Conway’s grid of cells, which follow four rules and produce patterns that move and grow.
Gardner, 1970
-
1971Agent-based models
Thomas Schelling showed that simple rules about individual preferences produce segregation that no individual intended.
Schelling, 1971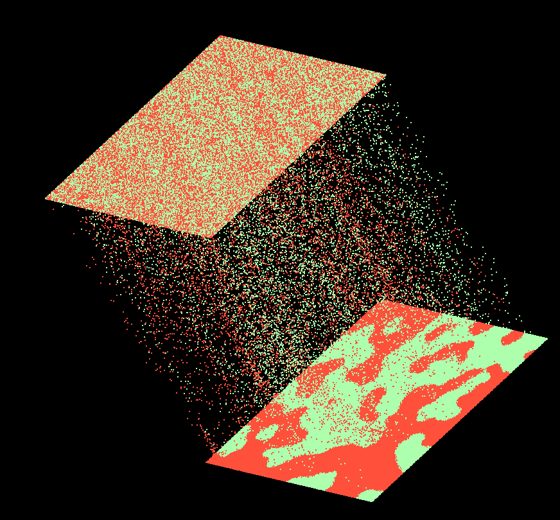
-
1971Conjoint analysis
Paul Green and Vithala Rao brought conjoint measurement into marketing. Respondents rank product profiles, and the method estimates how much each feature is worth to them.
Green and Rao, 1971 -
1972The Limits to Growth
Donella Meadows and colleagues at MIT used Forrester’s methods in World3, a computer model of population, industry, food and pollution, to simulate scenarios to 2100 for the Club of Rome.
Meadows et al., 1972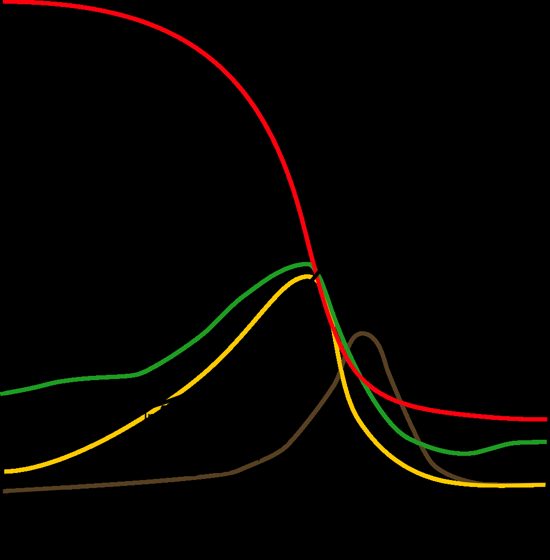
-
1980Computer tournaments
Robert Axelrod ran a repeated prisoner’s dilemma between strategies submitted as programs. The simplest entry, Anatol Rapoport’s tit for tat, won.
Axelrod, 1984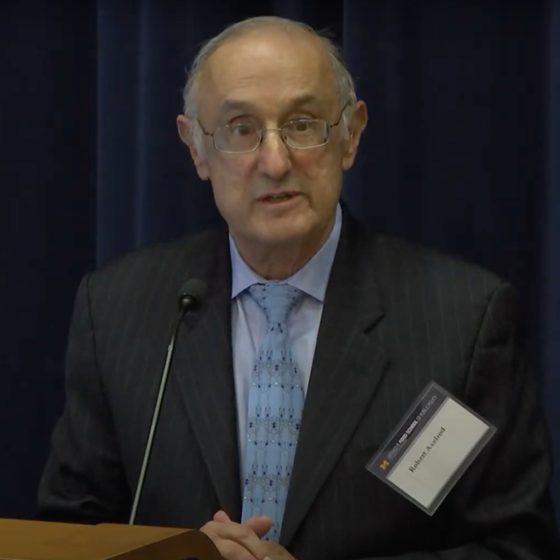
-
1984The Santa Fe Institute
Scientists, mostly from Los Alamos, founded an independent institute for the study of complex systems.
Waldrop, 1993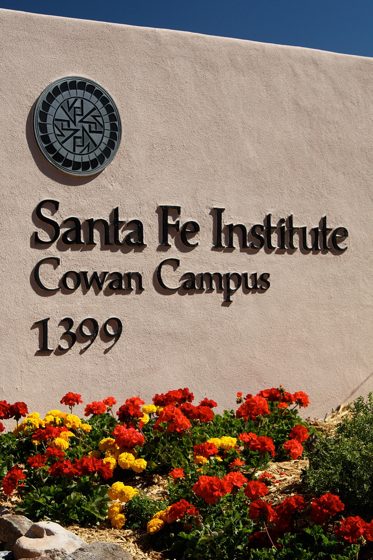
-
1996Artificial societies
Joshua Epstein and Robert Axtell produced inequality, migration and trade in simulated societies from local rules alone.
Epstein and Axtell, 1996 -
1996Swarm
The Santa Fe Institute described Swarm, one of the first general-purpose software libraries for building agent-based simulations.
Minar et al., 1996 -
1999NetLogo
Uri Wilensky released NetLogo, a free agent-based modelling environment. Its models library includes Schelling’s segregation model.
Wilensky, 1999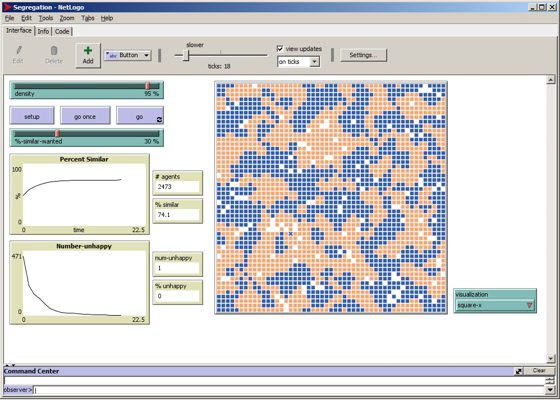
-
1999Leverage points
Donella Meadows ranked twelve places to intervene in a complex system, from changing numbers such as taxes to changing the goals and assumptions behind the system.
Meadows, 1999 -
2000Multi-method simulation
AnyLogic combined system dynamics, agent-based and discrete-event models in one commercial tool.
AnyLogic -
2000Discrete choice
Daniel McFadden shared the economics Nobel for models of how individuals choose between a fixed set of options. In the 1970s he used them to forecast ridership on San Francisco’s BART trains before the system opened.
McFadden, Nobel 2000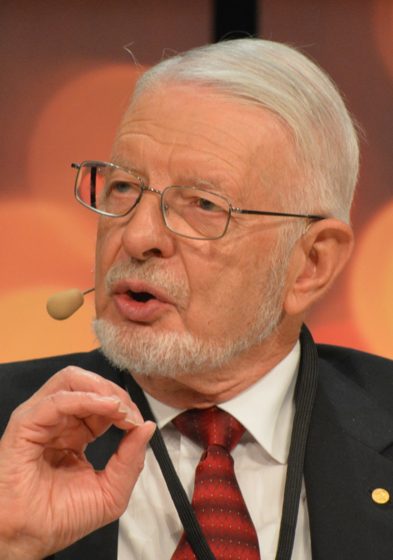
-
2013Public traces, private traits
Facebook likes alone predicted people’s personality traits and their party.
Kosinski et al., 2013
-
2020GPT-3The turning point
OpenAI’s 175-billion-parameter model could do new tasks from a few examples in its prompt. Later studies used it to answer as a described person, and the first social simulacra and silicon-sample studies were built on it.
Brown et al., 2020 -
2022Social simulacra
Joon Sung Park and colleagues used a language model to generate thousands of community members and their posts, so designers could see how a social platform might be used before launch.
Park et al., 2022 -
2023Generative agents
Twenty-five language-model agents lived in a simulated town, kept memories, planned their days and organised a party between them.
Park et al., 2023 -
2023Silicon samples
Language models prompted with demographic backstories reproduced the opinion distributions of US subgroups, and predicted individuals’ votes from their backstories. The backstories held demographics only, not each person’s own answers.
Argyle et al., 2023 -
2023Whose opinions?
The opinions language models give by default differed from those of many US demographic groups.
Santurkar et al., 2023 -
2024Agents of 1,052 real people
Agents grounded in an interview with each person reproduced 85% of that person’s own consistency when retested two weeks later.
Park et al. (Simile), 2024 (v1) -
2024Synthetic replacements tested
Synthetic survey answers varied less than real ones, and many regression results estimated on them changed size or sign.
Bisbee et al., 2024 -
2025Digital twins, measured
Twin-2K-500 scored twins at 0.717 ordinal alignment. A mega-study on the same people found that on new stimuli twins correlated with their humans at r ≈ 0.20.
Toubia et al., 2025; Peng et al., 2025 -
2025Fine-tuning on human responses
Fine-tuning on large sets of human responses brought models closer to the spread of real answers, though closer matching can lower single-answer accuracy. One model was trained to predict behaviour across many experiments.
Kolluri et al. (Simile), 2025; Binz et al., 2025 -
2025Misportrayal and flattening
Models prompted with an identity reflected what outsiders think of a group more than what its members say, and treated each group as uniform.
Wang et al., 2025 -
2026Twins from panel and customer data
Twins built from German panel microdata reached 0.73 ordinal alignment on average and 0.788 at best. Anacreon, a mixture of models each fine-tuned on similar people, reported a median of 0.775 on one customer audience.
Kinzinger and Hartmann, 2026; Dahiya (Semilattice), 2026
Image credits
- 1662, The first life table: John Graunt, 1662, Public domain
- 1835, The average man: Joseph-Arnold Demannez, 1875, Public domain
- 1936, The scientific poll: Norman James, Toronto Star Photograph Archive, courtesy of Toronto Public Library, Public domain
- 1949, The Monte Carlo method: Los Alamos Laboratory, Public domain
- 1955, Bounded rationality: Richard Rappaport, 1987, Carnegie Mellon University, CC BY 3.0
- 1961, System dynamics: National Institute of Standards and Technology, 1966, cropped, Public domain
- 1970, The Game of Life: Rodrigo Silveira Camargo, Public domain
- 1971, Agent-based models: DMt1LD5Mp3, CC BY 4.0
- 1972, The Limits to Growth: Kristo Mefisto, CC BY-SA 4.0
- 1980, Computer tournaments: Ford School, University of Michigan, CC BY 3.0
- 1984, The Santa Fe Institute: Go2placitas, CC BY-SA 3.0
- 1999, NetLogo: MTheiler, CC BY-SA 4.0
- 2000, Discrete choice: Bengt Oberger, CC BY-SA 4.0